Creating A Daily Productivity App in ReactJS
Productivity app with ReactJS andChartsJS — Mini Project for Beginners in 10 easy steps.
This article is a step-by-step guide for making a mini project in ReactJS covering concepts of function-based components, hooks, local storage, charts.js, and other npm libraries. Let's dive right into it! Also, You can check my code here if you get stuck anywhere.

Step 1 : Create React App
Let's start by creating our react app by typing the command npx create-react-app my-app in the terminal. Now cd into the my-app folder that just got created and run npm start. Voila! You just run your new project!
Step 2 : Files and Folders
Now, we are going to need to make some files and folders. Inside the src folder, make a folder called Components. This folder will contain three files. Productivity.js , Productivity.css (stylesheet) , LineChart.js. Clear up the App.js and App.css (your styles, your wish) files so that you have a clean slate. Next, let us render our Productivity into App and LineChart into Productivity.
//App.js
import Productivity from './Components/Productivity'function App() {
    return (
        <div className="App">
            <Productivity />
        </div>
    );
}export default App;//Productivity.js
import LineChart from './LineChart'
import './Productivity.css'const Productivity = () => {
    return (
        <div className='productivity-container'>
            <LineChart />
        </div>
    );
}export default Productivity;
Step 3 : Installing Packages
Jumping into the main part. Remember, all the code from now on will be written in the LineChart.js file. But before we go any further, let us install the packages and dependencies we will be needing. For that, run the following commands in the terminal. We will also import these into our file.
npm i chart.jsnpm i react-chartjs-2npm i react-hooks-useformnpm i jquery
import React,{useState, useEffect} from 'react'
import { Line } from 'react-chartjs-2'
import { useForm } from 'react-hook-form'
import * as $ from 'jquery'
import './Productivity.css'
Step 4 : Days In This Month
We need the x-axis of our chart to have the exact number of labels as there are days in the current month. Let's make a function that returns exactly the same. Not only this, we are going to want to use this function in different places. It's going to be very important.
function daysInThisMonth() {
    var now = new Date();
    return new Date(now.getFullYear(), now.getMonth()+1, 0).getDate();
}
Any chart in charts.js takes in two parameters: data and options. Now, our data has to be dynamic so we will be using useState hook for that. But for the options, let us declare them at the beginning itself. We won't be tampering with them anytime.
const options = {
    scales: {
        yAxes: [
            {
                display: true,
                ticks: {
                    beginAtZero: true,
                },
            },
        ],
    },
};
Step 5 : Initialize Datasets
In this step, we will initialize our dataset which will feed into the ‘data’ parameter of the Line Chart using the useState hook.
const [datasets, setDatasets] = useState(
    {
        label: 'Your Productivity',
        data: Array(daysInThisMonth()).fill(0),
        fill: false,
        backgroundColor: 'rgb(60, 51, 92)',
        borderColor: 'rgba(60, 51, 92, 0.3)',
    },
)const data = {
    labels: Array.from({length: daysInThisMonth()}, (_, i) => i + 1),
    datasets: [datasets],
};
The Array(daysInThisMonth()).fill(0) is an array with the number of elements equal to the number of days in the current month and every element is 0. Kind of like [0,0,0,0,0,0,.....]and the Array.from({length: daysInThisMonth()}, (_, i) => i + 1) gives us numbers from 1 to days in the current month (x-axis).
Step 6 : The Form
The form. We want to take two inputs from the user. First, the date (the day number to be precise) and next, the productivity value. I prefer to keep my productivity on a scale of 0 to 10 but you can do it however you like.
Thus, we should keep in mind that our input fields need to be restricted to a set of values i.e.
- input 1 → 1 to number of days in the current month
- input 2 → 0 to 10
The useForm comes into the picture here. For that, initialize the necessary variables like const { register, handleSubmit } = useForm(); Now the form as shown below.
Step 7 : onSubmit()
Hang in there, we are close! Let us set up the onSubmit function which will trigger when our values are correctly submitted. What to do when the form is submitted? Simply update our dataset array (which has all 0s remember) such that it now has the given value at the given date index and feed it back to the Line Chart. Here, data.datasets[0].data is our above mentioned dataset array.
const onSubmit = (d) => {
    var prodValues = data.datasets[0].data;
    prodValues[d.day - 1] = d.prod;
    setDatasets({
        label: 'Your Productivity',
        data: prodValues,
        fill: false,
        backgroundColor: 'rgb(60, 51, 92)',
        borderColor: 'rgba(60, 51, 92, 0.3)',
    })
    $('#productivity-form').trigger("reset");
}
Step 8 : Heading and Rendering
Let’s add a small title, shall we? We will be using the getMonth() method in javascript. However, the catch here is that the getMethod() function returns a number. Look at this approach.
var month_names = ['January', 'February', 'March', 'April', 'May', 'June', 'July', 'August', 'September', 'October', 'November', 'December'];var date = new Date();var month = month_names[date.getMonth()];
and render the heading as <h2>Productivity For {month}</h2>
Finally render the line chart as <Line data={data} options={options} />
Step 9 : Local Storage
We are done! Start the app, try out your newly built graph and have fun!
Now, refresh the page. Oops! Well, the thing about React Apps is that they work amazing when you first run them. But, as soon as you refresh the page, POOF! All the data entered, all the states set gone in a jiffy :’(
Solution: (drum rolls please) Big Old Guy, Local Storage!
Let's fetch our data array from local storage into a variable.
const initialArray = (JSON.parse(localStorage.getItem("datasets")).arr)
There is still a problem here. What if we don't have an item called ‘datasets’ in our storage (when we run the app for the first time), what is this variable going to return, null? But what if we do? It's simply hard to tell so we need to apply a null check as follows.
const initialArray = localStorage.getItem(‘datasets’) ? (JSON.parse(localStorage.getItem(“datasets”)).arr) : (Array(daysInThisMonth()).fill(0));
Which means that, if there exists a ‘datasets’ object in local storage, well, that's wonderful, put it’s array into the variable ‘initialArray’. But if it doesn't, no problem, just take the all-zero array as the ‘initialArray’.
Step 10 : useEffect Hook
We are fetching this array from local storage alright but where are we actually setting it? We need to set the array every time there is a change in the dataset. For this, useEffect hook is used.
useEffect(() => {
    var array = { arr: datasets.data }
    window.localStorage.setItem('datasets', JSON.stringify(array))
}, [datasets])
And also modify our dataset declaration a bit
const [datasets, setDatasets] = useState(
    {
        label: 'Your Productivity',
        data: initialArray,
        fill: false,
        backgroundColor: 'rgb(60, 51, 92)',
        borderColor: 'rgba(60, 51, 92, 0.3)',
    },
)
We are officially done!
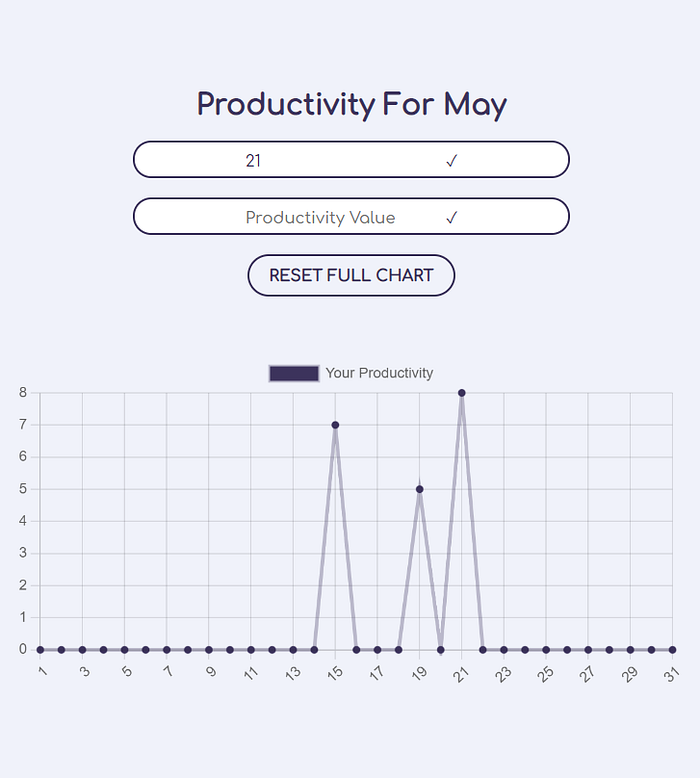
With a little styling, you can make the app look very beautiful. Here’s mine. You can check my code here if you are stuck anywhere.
Thank You so much for reading this article. This was my first ever article. Hope you liked it.
Project Link: https://daily-productivity.web.app/
Repository Link: https://github.com/AsavariA/daily-productivity
Thanks again!

